— News Center —
Advances in angiography of coronary atherosclerosis
7/18/18
Coronary angiography has been widely used to diagnose the severity of coronary artery stenosis, to help analyze the blood vessels of criminals, and to observe drug treatment responses. It has become the gold standard to determine the severity of coronary artery stenosis. However, it was also found that there were many defects in the contour of the coronary artery shown by coronary angiography, such as failure to analyze the wall lesions. This situation forces the development of devices or systems that can see the walls of the coronary arteries. Existing imaging techniques can directly see the plaque structure on the wall of the tube, evaluate the quality after revascularization, follow up the effect of drug therapy, and help identify vulnerable plaques that are vulnerable to rupture and cause events. Therefore, endovascular imaging technology is increasingly important.
1. computer tomography (CT)
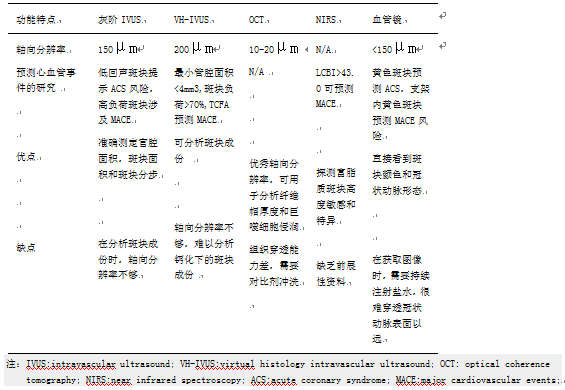
There are two different types of CT: EBCT: Electron beam computed tomography and MDCT (multi-detector-row computed tomography). A growing body of evidence suggests that EBCT/MDCT have assessment of coronary artery calcification (coronary artery calcification, CAC), coronary atherosclerosis and blood flow reserve score (FFR) ability. Figure 1. Evaluation of MDCT coronary artery calcification (A) normal coronary arteries without any calcification; (B) mild calcification of the left trunk and the left anterior descending artery; (C) serious calcification involving the left trunk, the left anterior descending branch and the left circumflex branch. CAC: coronary artery calcification of coronary artery calcification. Figure 2. Multi-slice spiral CT (MDCT) was used to evaluate the characteristics of coronary plaque (A) mild stenosis (white box) was observed in the proximal segment of the left anterior descending branch; (B) the section shows positive remodeling (yellow dotted line); (C) cross-sectional images in segments with positive reconstructions; (D) significant plaque load was observed. White line, lumen area; White dotted line, vascular wall area. MDCT, multi-slice spiral CT. These observations demonstrate the wide applicability of MDCT in clinical Settings. For example, MDCT can be used to screen coronary artery stenosis to avoid unnecessary invasive coronary angiography. 2. Magnetic resonance imaging (MRI) and magnetic resonance angiography (MRA) High resolution MRI and MRA are multifunctional non-invasive imaging modalities of coronary artery stenosis and plaque characterization. Figure 3 cardiac MRI enhanced by coronary contrast agents (A) invasive coronary angiography showed mild stenosis in the right coronary artery; (B) MRA shows the right coronary artery; (C, D) contrast enhanced cardiac MRI showed increased diffuse contrast in the right coronary artery (white arrow). MRI, magnetic resonance imaging; MRA, magnetic resonance angiography. Figure 4 HIP measurement on MRI (A) the stenosis (arrow) identified by MDCT as having positive remodeling at the proximal end of the left anterior branch; (B) in the corresponding sections of the CMR, "high signal point" (dotted arrow) (C) severe coronary artery stenosis shown on invasive coronary angiography at the proximal end (arrow) of the anterior descending branch of the left (arrow) was observed; (D) positive remodeling and ultrasonic attenuation observed in IVUS imaging (arrow). IVUS, intravascular ultrasound; HIP, high signal plaque; MDCT, multi - detector computed tomography. CMR, coronary MR. 3. Grayscale IVUS IVUS, intravascular ultrasound, IVUS) application of micro crystal element, can produce high resolution crosscutting vascular wall and lumen. Axial resolution is about 150 francs m, lateral resolution is about 300 francs m. The lumen, wall and plaque area can be quantitatively analyzed. IVUS guided PCI (percutaneous coronary intervention, PCI) can reduce the rate of restenosis, stent thrombosis and thrombotic events, 11. It can also be used to observe the natural development of coronary plaque after drug treatment. Figure 5 gray-scale IVUS plaque morphology (IVUS, intravascular ultrasound) (A) Attenuated plaque: 3-9 o 'clock (star sign); Attenuated plaques with deep ultrasound attenuation were Attenuated, not calcified, or very dense fibrous plaques (FIG. 5A). (B) echolucent plaque: the arrow indicates the non-echogenic area in the plaque; Non-echogenic plaque refers to the absence of ultrasonic reflection or low ultrasonic reflection in the plaque (FIG. 5B), the plaque contains high lipid. (C) calcified nodule: irregular inner cavity surface and prominent inner cavity; Calcified nodules are also the type of plaque associated with acute coronary events. Mainly fibrocalcified plaques, few or no necrotic cores. (D) spotty calcification: small calcification points within plaque; Severe calcification is clinically stable, and scattered or dotted calcification plaque is more unstable. Pathological studies have shown that small amounts of calcium in high-risk lesions often result in ACS or sudden death. (E) multiple layer appearance: multiple arrow marks. Multilayered plaques revealed by gray-scale IVUS ultrasound are a high risk feature for coronary heart disease. It is suggested that recurrent wall thrombus is related to plaque progression. 4, and Virtual histology intravascular ultrasound (Virtual histology intravascular ultrasound, VH IVUS) The ability of grey - medium IVUS to analyze tissue components in atherosclerotic plaque is limited. Tissues in VH - IVUS can further analysis of plaque composition, reflect the ultrasound rf energy into a color-coded map of visible to the naked eye color group, it divides into the plaque: fibrous plaques (fibrous), fiber fatty plaques (fibrofatty), necrotic core plaques (necrotic core) and density calcified plaque (dense calcium); 5, Near infrared spectral mirror (Near - infrared spectroscopy, NIRS) Spectroscope USES the interaction between light and molecules to measure electromagnetic spectrum. In the coronary artery cavity, due to the different chemical characteristics of biological tissue, the NIRS image can analyze the lipid and protein content of atherosclerotic plaque. The sensitivity and specificity of NIRS in lipid detection were 90% and 93%, respectively. The catheter NIRS imaging system has been used in clinical practice (InfraReDx, Burlington, Massachusetts, USA). Also known as chemical imaging (chemogram) (figure 9). Figure 9. Right coronary lipid plaque detected by nirs-ivus A. The catheter is automatically withdrawn from the middle segment of the right coronary artery (red arrow) to the proximal end of the right coronary artery (blue arrow head). B.ivvus shows plaques visible from 9 to 4 o 'clock. The ring around the IVUS image represents the NIRS value. The lipid plaque is yellow and the non-lipid plaque is red.nd. 6. Coronary angioscope Mirror coronary arteries (Intracoronary coronary angioscopy) through the fiber optical system to the surface of the plaque, the body case rate < 150 microns. The advantage of coronary angioscopy is to analyze plaque color and plaque surface characteristics. The color grading of plaque is white, light yellow, yellow and dark yellow (figure 10). White: fibrous plaque; Yellow: fatty or necrotic core plaque; Dark yellow: unstable plaque with thin fibrous cap and large lipid core. Stable plaque, smooth surface; Complex plaque with irregular surface; Angioscope can also see rupture plaques, insect plaques, fibrous caps, crack plaques and ulcer plaques. FIG. 6 angioscope plaque classification Existing invasive imaging systems in vivo can assess plaque load and plaque composition, identify vulnerable plaque, help explore atherosclerosis mechanisms related to coronary events, and track the effect of anti-atherosclerosis drugs on coronary atherosclerosis. These devices have greatly advanced our understanding of coronary atherosclerosis, but their axial resolution, penetrability and ability to distinguish plaque composition remain limited (table 1). If the spatial resolution can be improved, the composition of coronary atherosclerotic plaque can be further analyzed accurately. The new OCT resolution is about 10 centimetres, which can clearly analyze the cellular and subcellular structures. Image fusion technology has the potential to overcome the inherent limitations of each imaging system. For example, NIRS and IVUS fusion can simultaneously assess vascular structure and plaque composition. The new fusion imaging system under development has the potential to achieve the magic of plaque imaging, helping clinicians understand and observe plaque and more effectively treat patients with coronary heart disease.


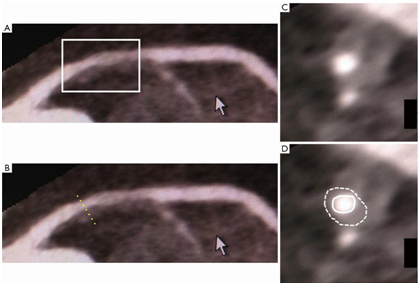

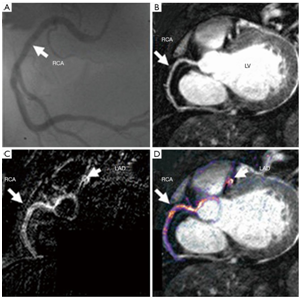

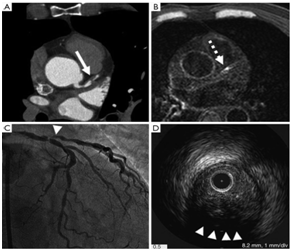


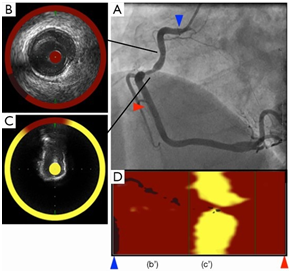


Table 1 functional characteristics of different endovascular imaging systems